Your Google Business Profile (GBP) posts can do more than look active — they can drive real calls, clicks, and visits if you read the numbers and act on them. GMB Everywhere puts post metrics right on the screen so you can skip downloads and guesswork. This guide shows how to read those numbers, spot what's working, and focus on posts that bring results.
How to See Post Insights with GMB Everywhere
Install the Chrome extension at gmbeverywhere.com. Click Add to Chrome, pin the icon, and log in.

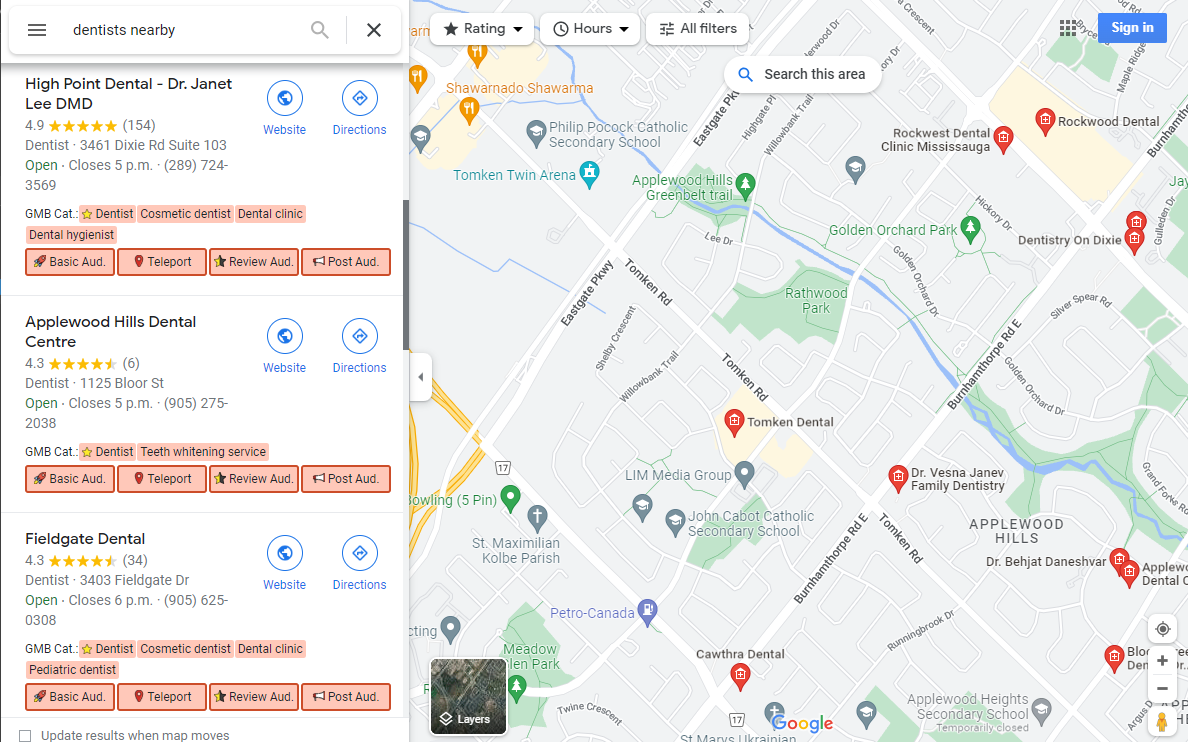
Search for your business in Google Maps. Click the GMB Everywhere icon and choose Post Audit.
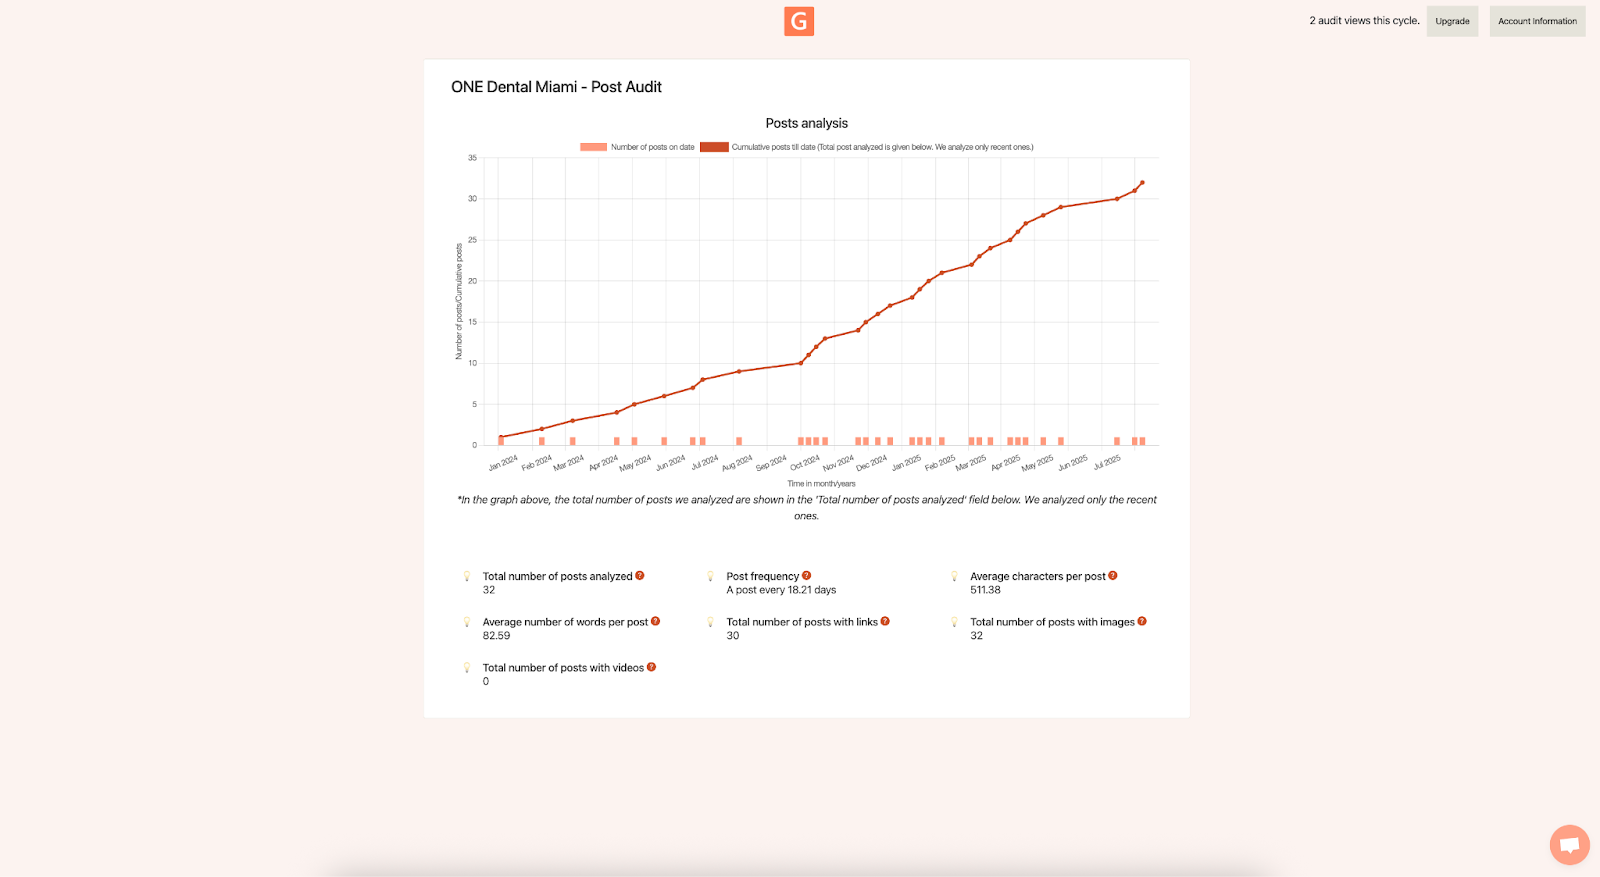
The page shows:
- A quick timeline of how often you post.
- Totals like Post frequency, Average words, Posts with images/videos/links.
Understand the Three Core Metrics
There are 3 commonly measured metrics for posts:
- Impressions — how often a Post was shown in Search or Maps. Good for visibility trends.
- Clicks — how many people tapped to open the Post. Use this to measure interest.
- CTA actions — taps on buttons like Get Offer or Learn more. Treat these as micro-conversions.
Impressions: Your Visibility Gauge
High impressions mean your topic or timing matches what people search for. If a post gets lots of impressions but few clicks, the headline may be bland or the image not inviting. Adjust the first line, image, or offer and test again.
Clicks & CTR: Did the Post Pull Them In?
Calculate a quick CTR (Click-Through Rate) = Clicks ÷ Impressions × 100. Offer and Event Posts often earn higher CTR because the value is clear. If an Update Post sits under 5% CTR, try sharpening the hook ("24/7 emergency leak fix—call now") or adding a price or time frame.
CTA Actions: Proof People Want It
CTA actions show the strongest intent. Track how many tapped Get Offer, Book, or Call. A post with modest impressions but a high CTA count is worth repeating — use the same style again. If actions lag, try a clearer button ("Get Quote") or pair the button with a strong benefit in the first sentence.
Build a Simple ROI Sheet (5 Minutes)
Open a spreadsheet and list each Post in rows. Add columns for: Impressions, Clicks, CTA actions, Time spent (minutes), and Estimated value per action (your average sale or lead value). Then compute:
ROI per Post = (CTA actions × value per action) ÷ (time spent)
This quick math shows which Post types pay off fastest, so you spend time on what works.
Compare Post Types & Find Your Winners
Tag each Post as Update, Offer, or Event in your sheet. After 60–90 days, filter the sheet to see which type delivers the best CTR and CTA actions. Many profiles see: Updates = reach, Offers = actions, Events = mid-range. Your data will show what your audience prefers.
Timing & Frequency: Post When People Plan
Look at your Post timeline in GMB Everywhere and note gaps. Aim for a steady rhythm — for example, one post every 7–10 days. Test different publish times; midweek late morning often works, but your own results will tell you what's best. Log the time you post and watch for patterns in impressions and clicks.
Refine Themes, Not Just Formats
Create simple theme labels: Promotions, Tips, New Services, Team Spotlights, Community Events. Add a "Theme" column in your sheet. After a few weeks, filter by theme to see which ideas get the most clicks or actions. Lean into top performers next month.
Use Strong Visuals
Every Post should have a clear image or short video. Test what grabs more taps: product close-ups, before/after shots, or people at work. Publish two similar Posts with different visuals and compare CTR/CTA results right in the overlay.
Weekly Quick Checks (10 Minutes Every Monday)
- Update your metrics with last week's Impressions, Clicks, CTA actions.
- Flag Posts under your CTR target for a rewrite.
- List the top-performing theme and plan one more like it.
- Swap in a new image for any Post that underperformed visually.
- Review button use—does "Get Offer" beat "Learn more" for your audience?
Common Gaps and Quick Fixes
- Long blocks of text get skipped - put the main benefit up front and keep lines short.
- Generic headlines underperform - make the first 90 characters count.
- No clear action? Add a strong CTA in both the copy and the button.
- One-off tests fade — log every change so you can repeat wins.
Conclusion
Better GBP posts come from reading the data and acting on it. With GMB Everywhere showing your post stats in one place, you can see what works, fix what doesn't, and put your time into ideas that actually bring results. Check in each week and you'll start seeing more calls, visits, and sales.